Skip to main content
leapfrog
Digital strategies
Leapfrogging
Drupal
Projects
Contact
data visualization
Creative Examples Of Infographics
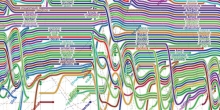
Linear Network Layouts
Thruthy: Visualizing the Diffusion of Information on Twitter
Expense visualizer
Storylines: Visualizing the Interactions during Software Development
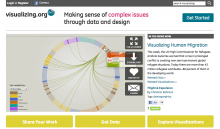
visualizing.org
Research: How Effective is Animation in Showing Temporal Trends?
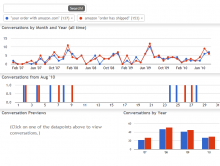
graph your inbox
Understanding Shakespeare: The Visual Form of Text and Language
David McCandless: The beauty of data visualization
Pseudovariety in Soft Drinks
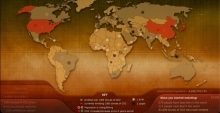
The Breathing Earth: Interactive Map Tracks Global Emissions in Real Time
A Different Approach to the Calendar
Hans Rosling on global population growth
‹ prev
8 of 10
next ›
About us
Services
Projects
Blog
Contact
Drupal
data visualization
(129)
misc
(73)
mapping
(66)
user-centric strategies
(45)
open data
(43)
drupal
(32)
government
(23)
usability
(20)
web analytics
(3)
3D printing
(1)
Search form
© Leapfrog Soluciones Web EIRL, 2023
Built with open source software
Powered by
Drupal